SETUP:
I’ve previously had great results connecting Adafruit 8×8 LED matrix displays to the BeagleBone Black via I2C:
- Adafruit 8×8 LED matrix controlled by BeagleBone Black
- LED ticker: BeagleBone Black & multiple Adafruit 8×8 displays
I decided to try out the Adafruit bi-color 8×8 LED matrix and hooked it up with the same I2C pins as before. You’ll need to setup the Adafruit_BBIO Python library if you haven’t already:
https://learn.adafruit.com/setting-up-io-python-library-on-beaglebone-black/overview
You’ll also want to grab the Adafruit Python libraries for the Raspberry Pi since they work on BeagleBone Black, too:
https://github.com/adafruit/Adafruit-Raspberry-Pi-Python-Code
BASIC DEMO:
Here is the BegaleBone Black running the demo program ex_8x8_color_pixels.py from the repo:
https://www.youtube.com/watch?v=vnHC6bVj5bc
CODE:
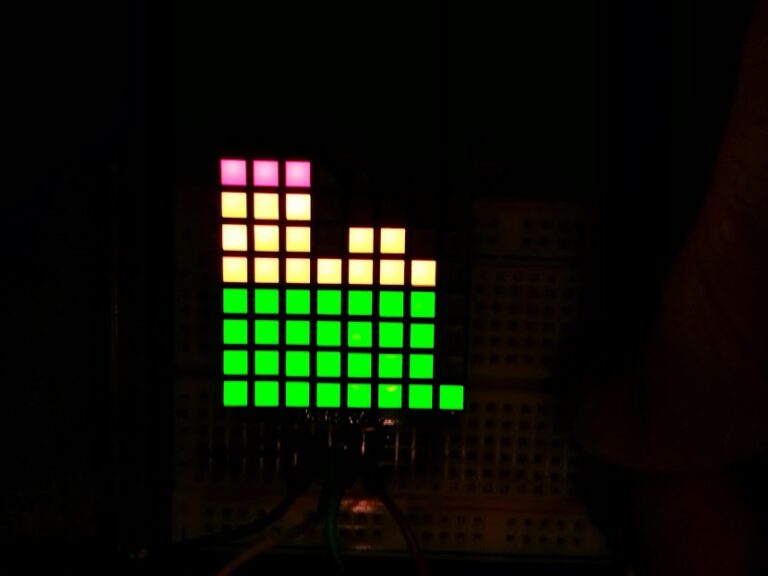
I thought it would be interesting to plot the readings from a sensor over time on the matrix with different colors representing the magnitude of the reading. I hooked up a pot to the analog input to simulate a sensor. Here’s the Python script:
https://github.com/pdp7/beaglebackpack/blob/master/plot.py
It is Invoked by this shell script so that PYTHONPATH will be set:
https://github.com/pdp7/beaglebackpack/blob/master/plot.sh
VIDEO: BeagleBone Black: plot analog sensor on Adafruit bi-color LED matrix
https://www.youtube.com/watch?v=QQNqxHQDj5E
Cheers,
Comments are not currently available for this post.