Categories: Beginner
Step 1: Test your sensor
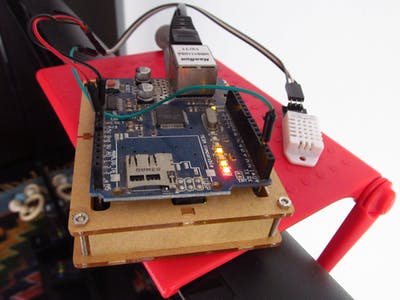
Take your sensor and connect the pin with the + sign to the pin labelled with 5V of the
Arduino Uno
. Then connect the pin with the – sign to the GND pin. And finally connect the third pin to the digital pin 2 of your Arduino.
Now open your
Arduino IDE
and go to
Tools -> Manage Libraries
. Search for the
DHT Sensor Library
and install it. It will ask you if you want to install its dependencies. Click on Install All.
The go to
File -> Examples -> DHT Sensor Library -> DHT Tester
. If your sensor is a DHT22 or an AM2302, you don’t need to change anything on the script. Compile it and upload it.
Then go to T
ools -> Serial Monitor
. If everything is working fine, you should see the readings of your sensor as text.
Step 2: Connecting to the Blynk cloud
IStill in the Arduino IDE, go to
Tools -> Manage Libraries
again. Search for the
Blynk Library
and install it. The library that we’re going to use for the
Ethernet Shield
should be built-in into the IDE and you shouldn’t need to install it.
Now go to your phone and install the Blynk app. It will ask you to register. Do it and Blynk will send you an email with an auth token. Copy it into your clipboard.
Now go the the
Blynk Example Browser
web page. Fill the form as follows:
- Board: Arduino Uno
- Connection: Ethernet Shield W5100
- In Auth Token, paste the token that Blynk sent to your email account.
- In Example, select DHT11.
Click on the
Copy Example
button and paste it into a blank sketch on your Arduino IDE.
In the code of the sketch, comment the following line:
#define DHTTYPE DHT11 // DHT 11
And uncomment this:
//#define DHTTYPE DHT22 // DHT 22, AM2302, AM2321
Also find the following line:
timer.setInterval(1000L, sendSensor);
And change 1000L by 2000L or more. This is because the AM2302, unlike the DHT11, needs to wait at least 2 seconds (= 2000 milliseconds) in between measurements.
Compile and upload the sketch to your Arduino board. Now let’s configure the Blynk app on your phone to display your sensor data.
Name your new project. On
Choose Device
, select Arduino Uno. In
Connection Type
, select Ethernet. And choose the UI theme of your preference. Finally, click on
Create
.
Now you should be able to add elements to the app dashboard. For this example we’re going to use one
Labeled Value
for the temperature, one
Gauge
for relative humidity and a
Super Chart
to graph the evolution of both values through time.
Let’s start with the Temperature. Click on the + sign and the
Widget Box
will open. Go to the Displays section and click on Labeled Value.
Put a title to your widget. For example, Temperature. If you recall the code of the Example Browser, the Temperature value is sent to the
Virtual Pin
V6. So click on
PIN
, and select Virtual -> V6.
In
label
, you can put something like
Temperature: /pin.#/ C
. Blynk will replace /pin.#/ with the value read by your sensor. The.# symbol tells Blynk to use one decimal place.
Finally, in the
Reading Rate
combo select PUSH. This is because Arduino will push the value every 2 seconds.
Next, let’s configure the Gauge Widget for the Relative Humidity.
This widget works in a very similar way to the Labeled Value. Put a title to it and click on PIN. Select Virtual -> V5. On the label, put /pin.#/ % and use 100 as the highest value, since the Relative Humidity will be a value between 0 and 100. In Reading Rate, select the PUSH option.
And finally, the Super Chart.
Add two datastreams to your super chart, one for the temperature pointing to the virtual pin V6 and another one for relative humidity pointing to the V5 virtual pin. The the Y-Axis scale to
Auto
and use only one decimal (#.#).
In the
time ranges picker
, select 7 time ranges of your choice.
Once you’re done configuring your Super Chart, click on the play button and your dashboard should start showing the data captured by your sensor. Your dashboard should look more or less like the image below.
You can take a look at a refactored version of the code
here
.
Step 3: Going Self-Hosted
Now that you have the basic functionality working, you have two options. One is to leave everything as it is. But keep in mind that one way in which Blynk monetizes its product is by limiting the number of widgets you can put in your dashboard, so you won’t be able to add too many more elements to it unless you pay a fee.
Another option is to have your own self-hosted server to keep your data on your network. This takes more work, not only to set it up but also to maintain. Also if you want to access your server from outside of your home network, you’ll have to make sure the server is secure. But the good thing is that it will allow you to add almost an unlimited number of widgets to your dashboard.
The minimal hardware requirements to run a
Blynk Local Server
is to have any system capable of running
Java 8
and at least 30 MB of free RAM. In my case, I’ll use an old
Beaglebone
running
Debian
. But you can use something more modern (and a bit more powerful) like a
Raspberry Pi Zero
.
First of all, make sure you have Java 8+ running on the device you’re going to use as a local server.
debian@beaglebone:~$ java -version

openjdk version "1.8.0_252"

OpenJDK Runtime Environment (build 1.8.0_252-8u252-b09-1~deb9u1-b09)

OpenJDK Client VM (build 25.252-b09, mixed mode)
Otherwise you can install it with the following command:
debian@beaglebone:~$ sudo apt-get install openjdk-8-jdk
Now download the jar file of the Local Server to your home directory (or any writable directory of your choice):
debian@beaglebone:~$ wget https://github.com/blynkkk/blynk-server/releases/download/v0.41.13/server-0.41.13-java8.jar
If you device supports Java 11, there’s a separate jar you can download and use without the suffix -java8.
You can read the full documentation to install and configure the Local Server
here
, but the most important step is to configure your
mail.properties
file as follows:
mail.smtp.auth=true

mail.smtp.starttls.enable=true

mail.smtp.host=smtp.gmail.com

mail.smtp.port=587

mail.smtp.username=YOUR_EMAIL_HERE

mail.smtp.password=YOUR_EMAIL_PASS_HERE
This is because once the server is running and you connect to it from the Blynk app, it will send the auth token to the email address you used to register. Unfortunately,
the server only works with Gmail accounts
. If you use 2FA, you’ll have to
setup an application password
to allow this to work.
Now, start the server.
debian@beaglebone:~$ java -jar server-0.41.13-java8.jar -dataFolder /home/debian/blynk/ &
The server has a web-based UI, but there isn’t a lot you can do there except seeing information about the devices connected to the server.
Now go to the Arduino IDE, take the refactored version of the code we wrote for the step 2 and change the function setupBlynk as shown below. You have to explicit tell the IP Addresses of both the server and the Arduino, the DNS server and the gateway and mask of your home network. You’ll probably have to take a look at your router settings to set this right.
void setupBlynk() {

  // You should get Auth Token in the Blynk App.

  // Go to the Project Settings (nut icon).


  char auth_server[] = "YOUR AUTH TOKEN HERE";


  IPAddress server_ip (192, 168, 1, 144);

  IPAddress arduino_ip  ( 192,   168,   1,  142);

  IPAddress dns_ip      ( 1,   1,   1,   1); // Cloudflare DNS

  IPAddress gateway_ip  ( 192,   168,   0,   1);

  IPAddress subnet_mask ( 255, 255, 255,   0);


  byte arduino_mac[] =  { 0xEF, 0x3A, 0x4E, 0x6A, 0x7D, 0xDE };


  Blynk.begin(auth_server, server_ip, 8080, arduino_ip, dns_ip, gateway_ip, subnet_mask, arduino_mac);

}
Once the server is running and you uploaded the modified sketch to the Arduino board, go to the app in your phone and logout from the Blynk cloud by clicking on the icon with the exit door. Select a
custom server,
put the IP address and port of your local server and create an account. The server will use the Google account that you configured on the
mail.properties
file to send you an auth token. Then you can login, create a project and add a device as we did on the step 2.
Now you’ll see the empty dashboard but this time, you won’t have any serious limitation about the number of widgets you can add to it. For example, you can set up two tabs. One for the temperature and another one for the relative humidity with two separate Super Graphs to display the data.
And that’s it. I hope you enjoyed going through this project as much as I did. Keep in mind that for this project I used a wired network, and because of that you’ll probably be forced to put both devices close to your router or to have very long Ethernet cables. But you should be able to accomplish the same with Wi-Fi by using a
ESP8266
compatible board like the
Wemos D1 Mini
for the sensor and a Raspberry Pi Zero for the server.
Another thing to consider is that you won’t be able to access the server from outside of your home network unless you set up a public IP for it. To view the sensor data probably doesn’t worth it, but you may consider it if you want to use the sensor readings to do things automatically like turning on/off an air conditioner before you arrive home.
Comments are not currently available for this post.